All projects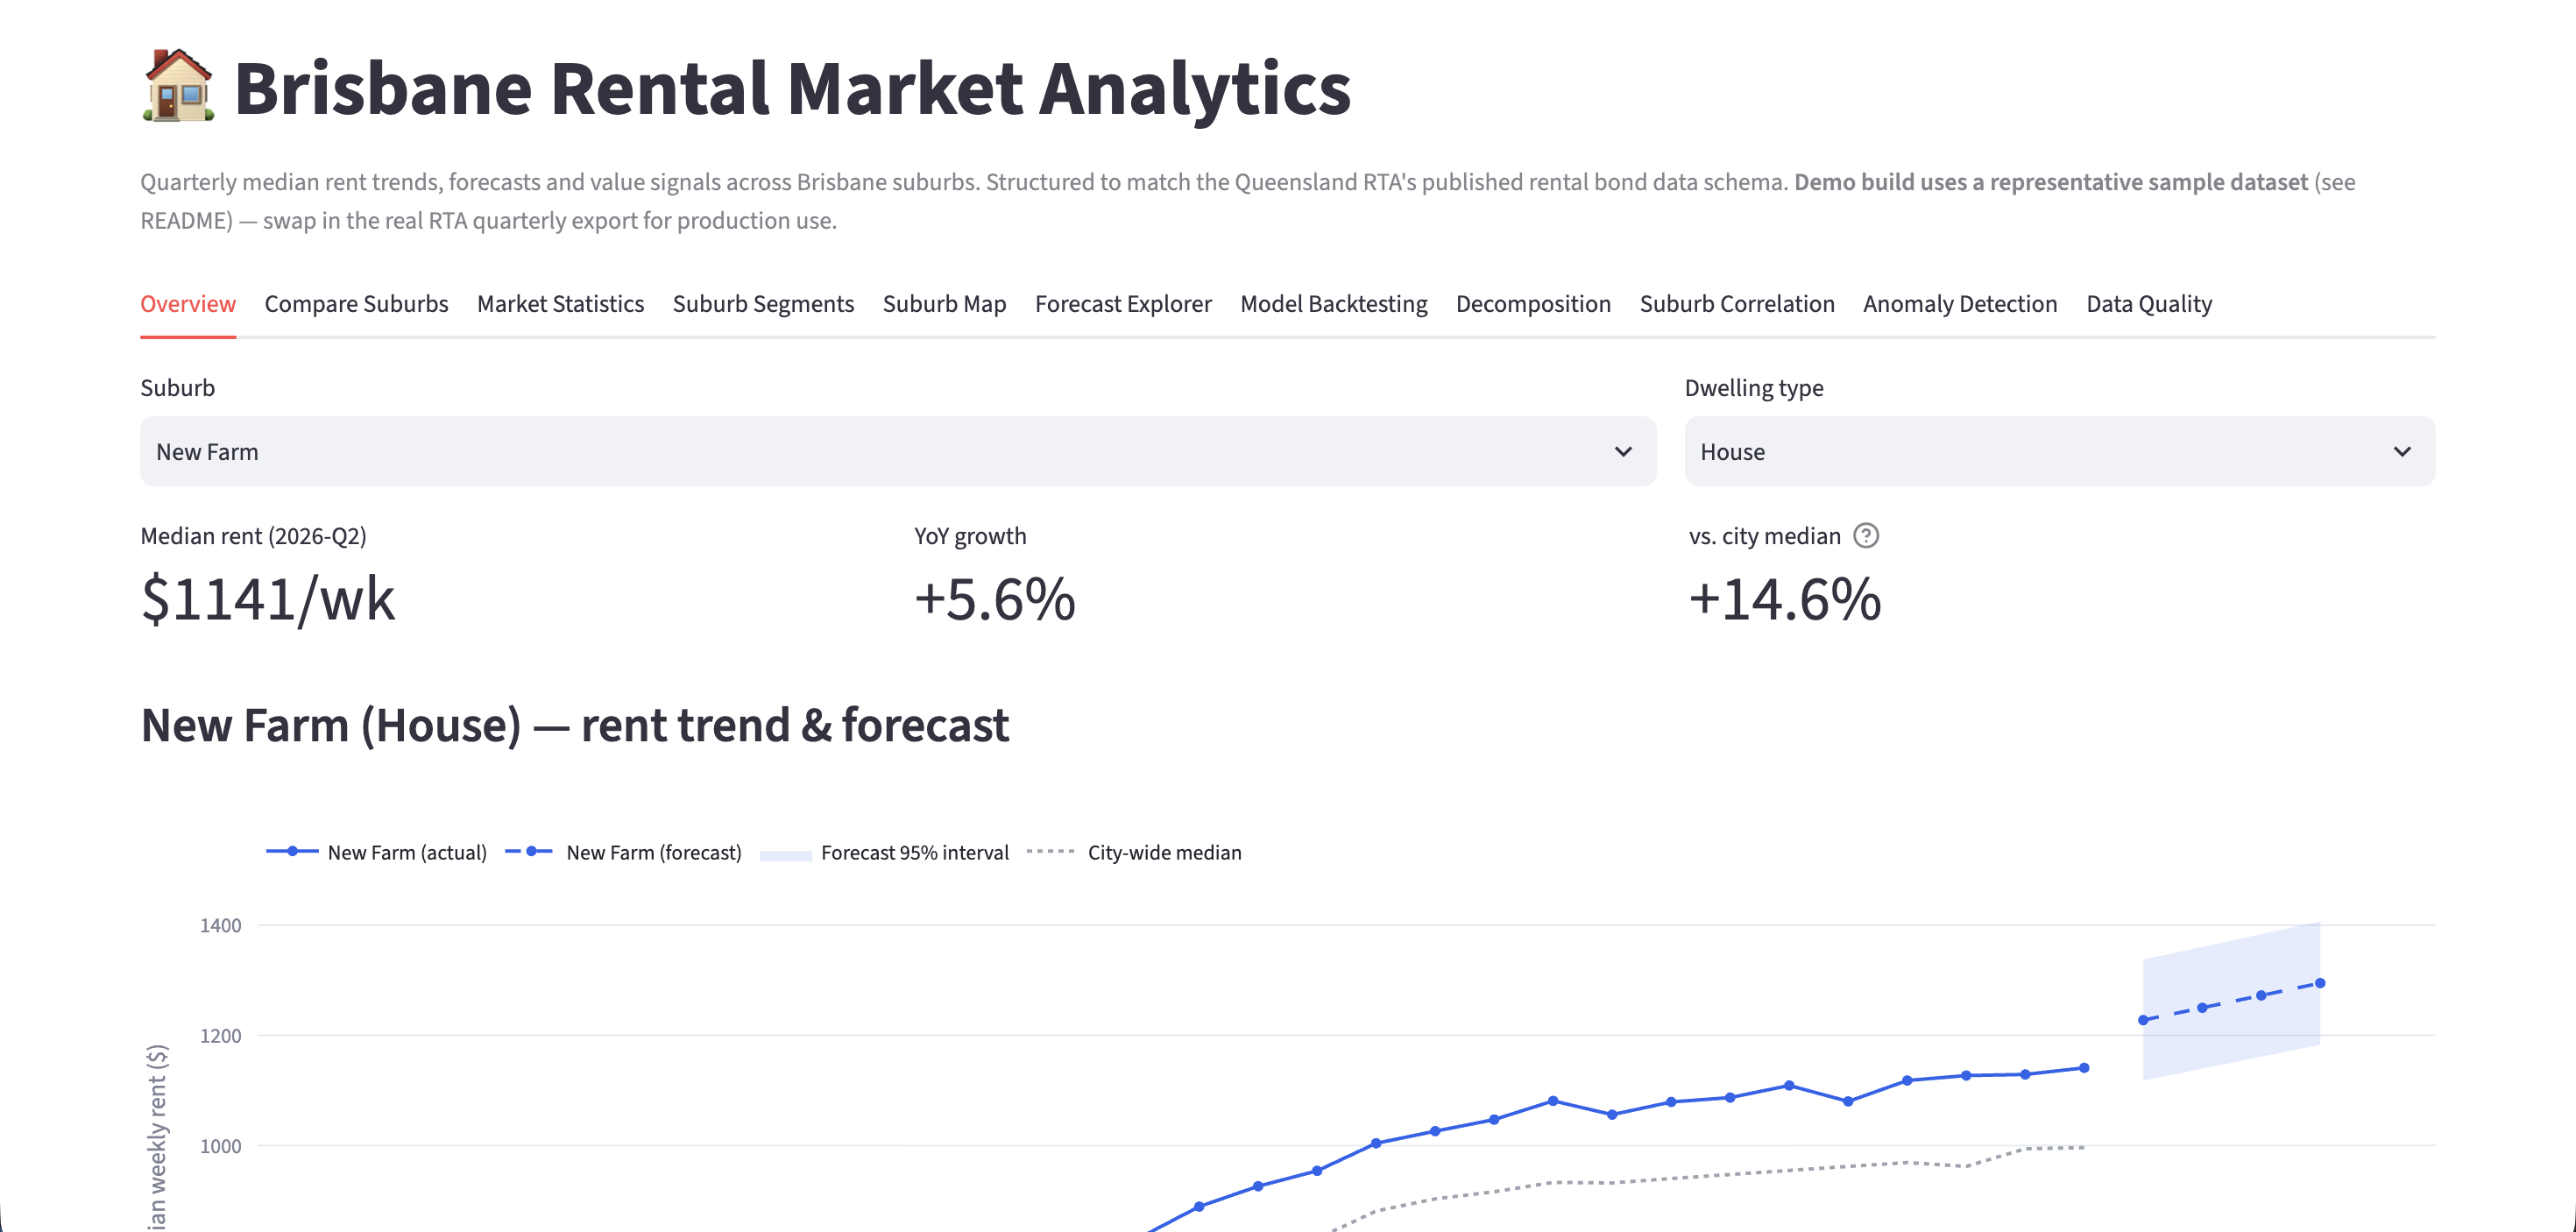
Data Analytics · End-to-End Pipeline
Brisbane Rental Market Analytics
Overview
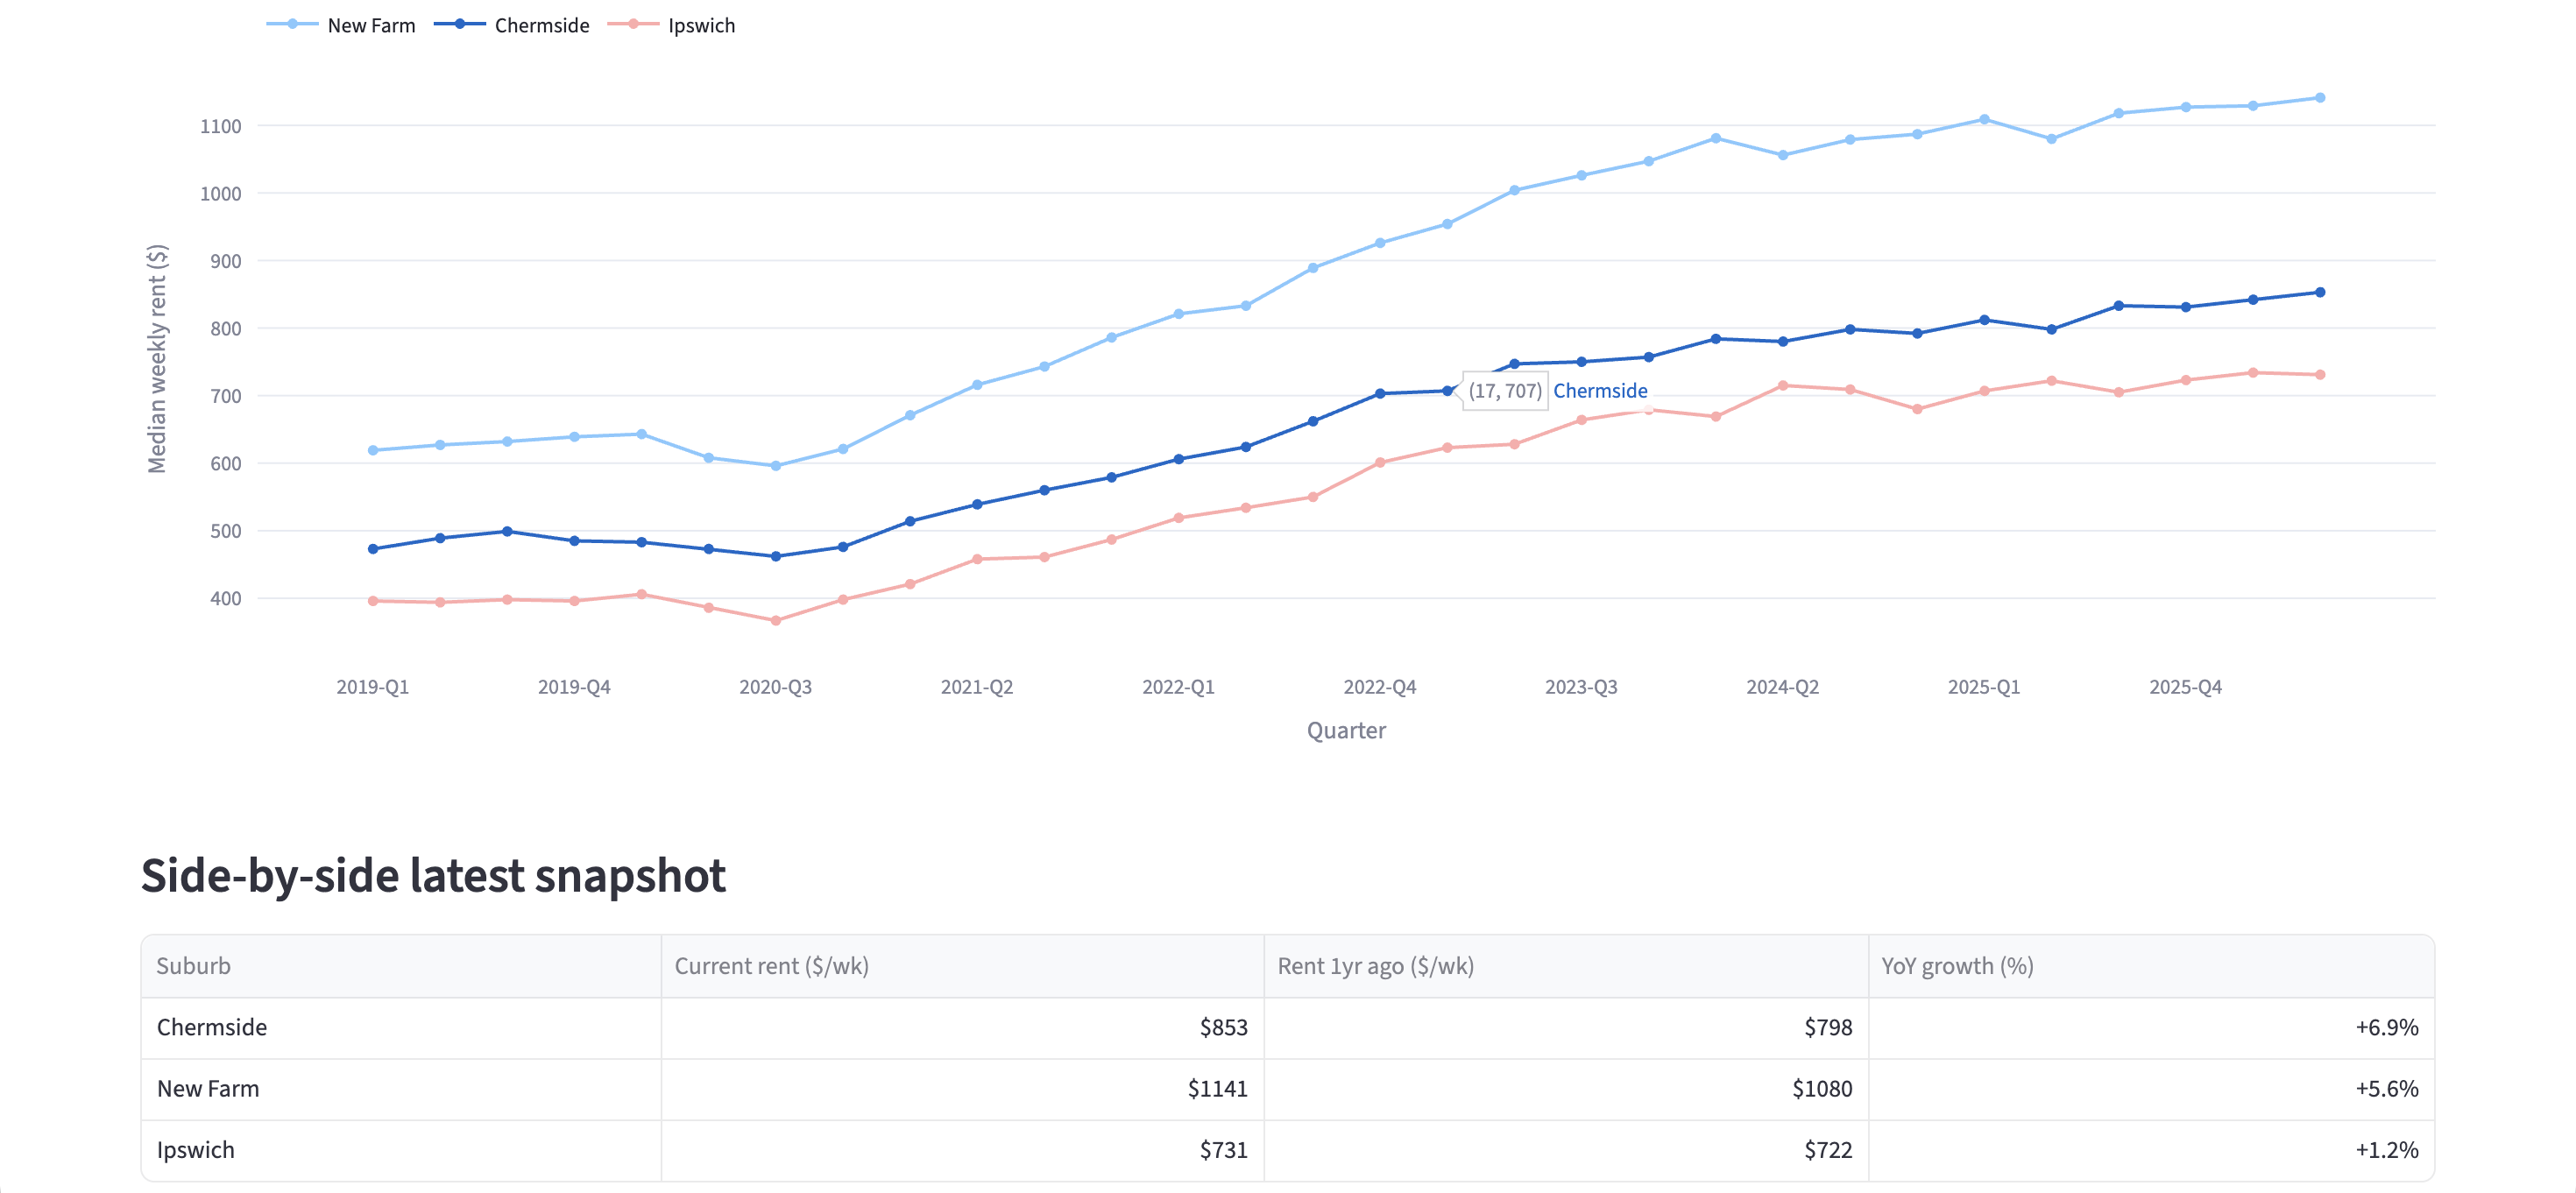
A complete data-analytics product for Brisbane's rental market: a real ETL pipeline, statistical forecasting, and an eleven-tab interactive dashboard. Given a suburb, it answers the three questions renters and investors actually care about — how rent has moved over the last ~7 years versus the city, where it is likely headed over the next year, and whether the suburb is currently a premium or a bargain. It's structured to match the Queensland RTA's published rental-bond schema, so it runs on the real quarterly export in production.
What we did
- Built a real ETL pipeline — ingest raw quarterly data, standardise suburb names, drop duplicates and missing values, remove statistical outliers, and load a tidy table into SQLite via SQLAlchemy.
- OLS trend forecasting with a 95% prediction interval and R²/residual diagnostics — an honest forecast, not a straight-line guess (R² ≈ 0.94 on New Farm houses).
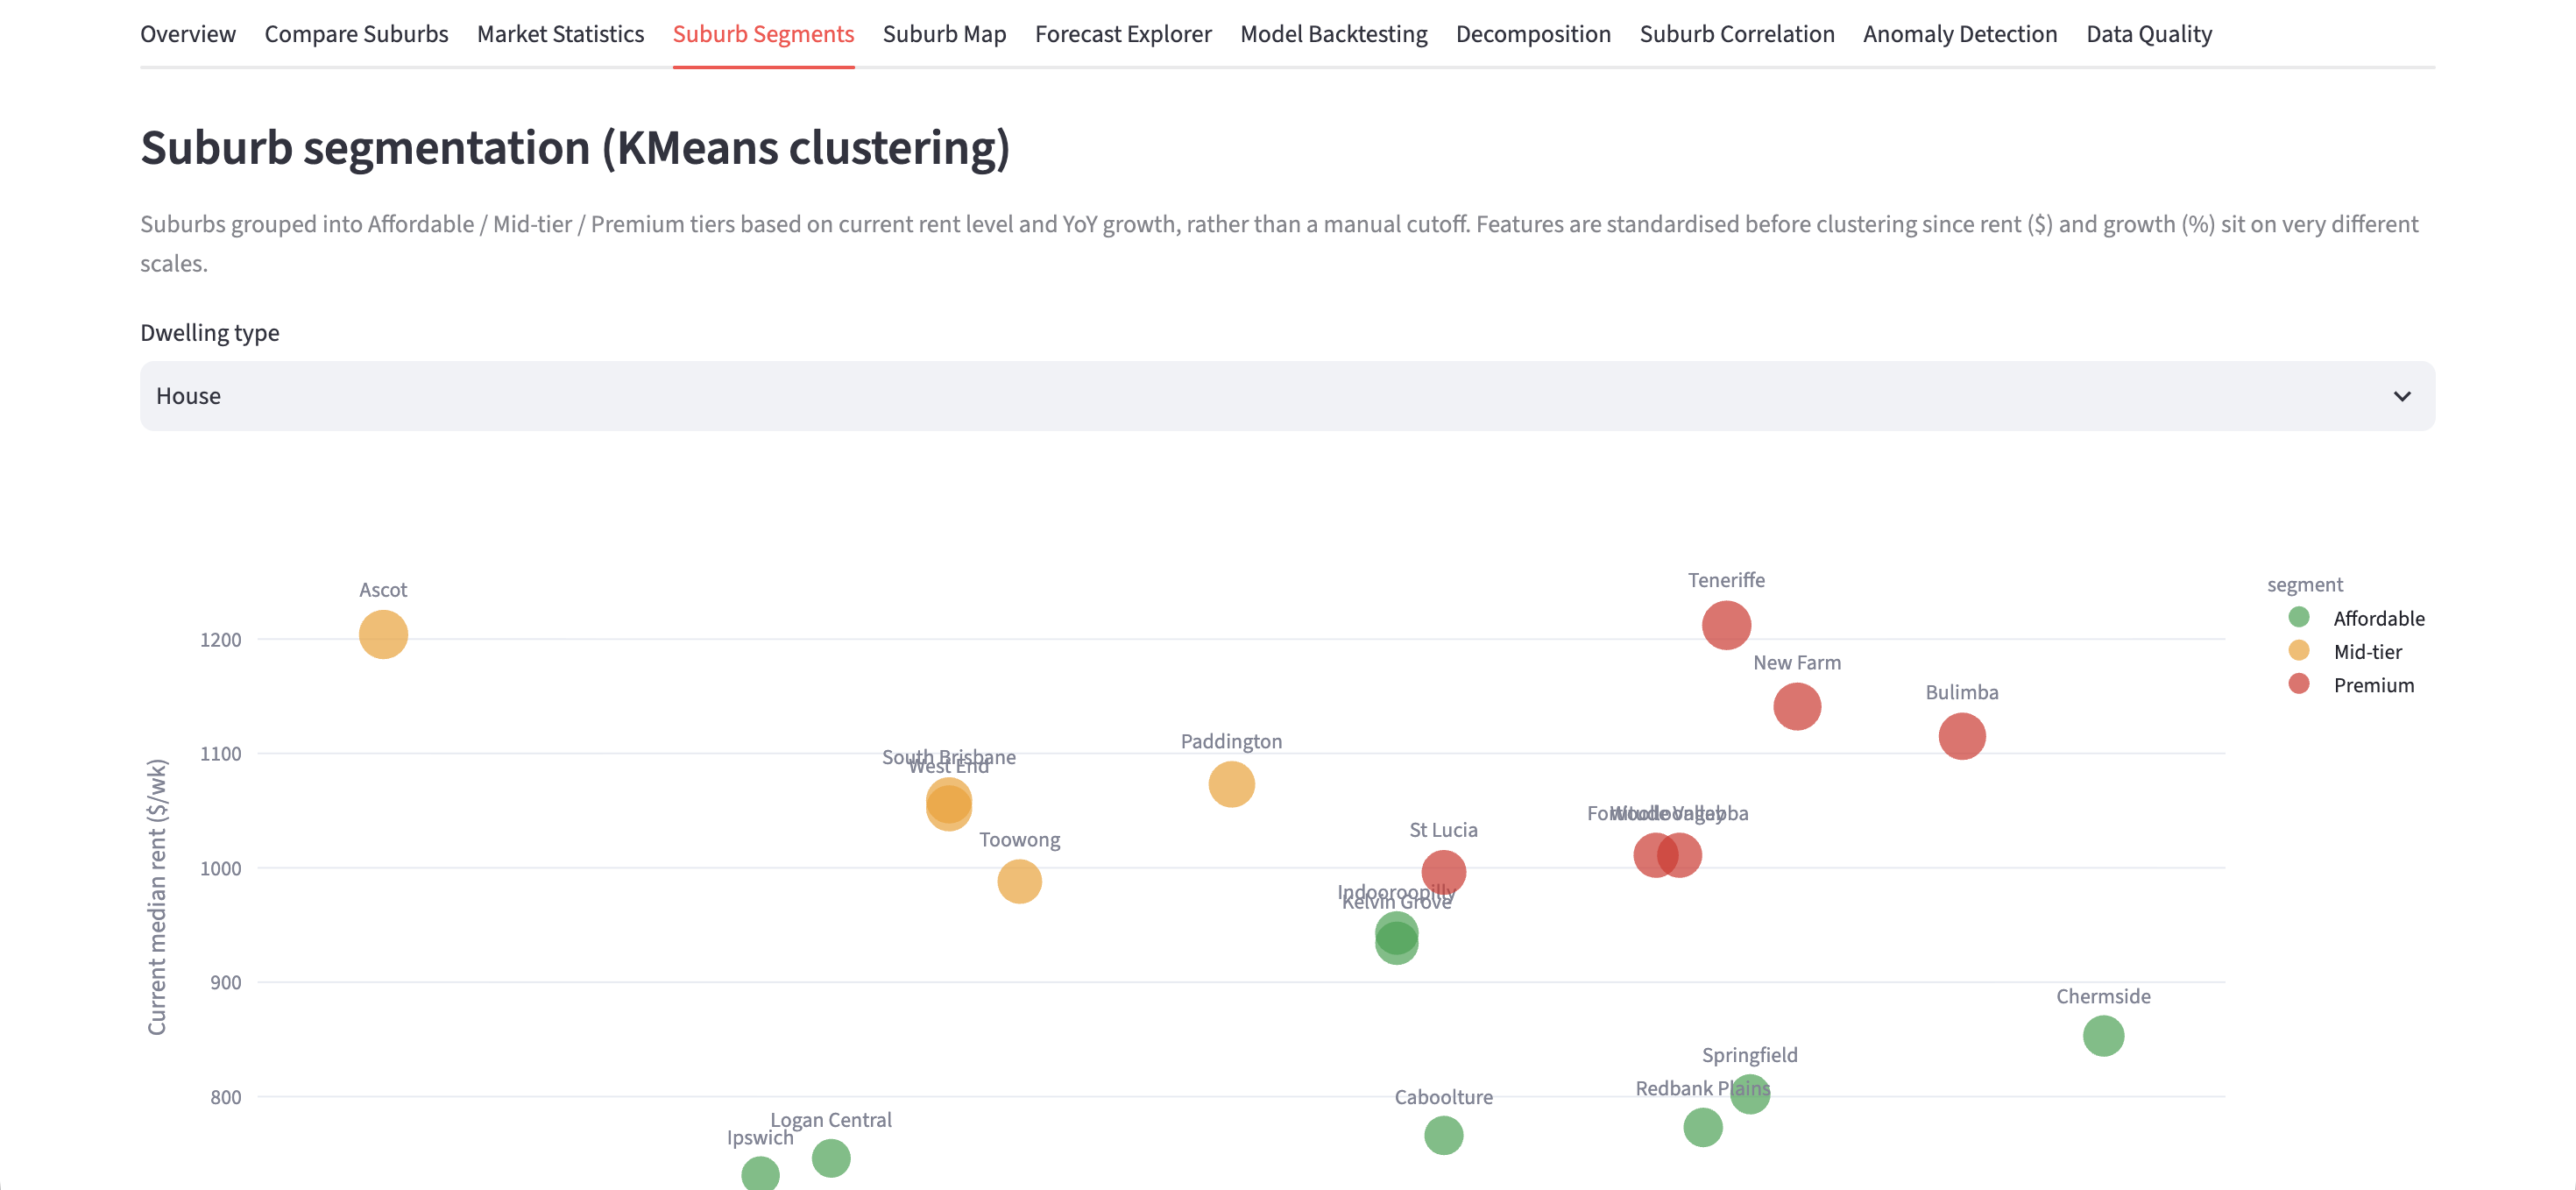
- KMeans suburb segmentation into Affordable / Mid-tier / Premium tiers from standardised rent-level and growth features.
- Model backtesting — OLS trend vs. Holt's exponential smoothing, trained with the last N quarters hidden and scored on MAE/RMSE/MAPE (proper train/test validation).
- Additive trend/seasonal/residual decomposition, a suburb-to-suburb correlation matrix, and Isolation Forest anomaly detection.
- An 11-tab Streamlit dashboard (overview, compare, statistics, segments, map, forecast explorer, backtesting, decomposition, correlation, anomalies, data quality) with CSV exports.
Tech stack
Outcomes
19 suburbs, 30 quarters (2019–2026) analysed
Forecasts with 95% confidence intervals
KMeans tiers: Affordable / Mid-tier / Premium
Production-ready — swap SQLite → Postgres in one line
Book a live demo